The staple for comparing engine performance among motorcycles and cars, outside of actually riding or driving them, has, for the most part, been the dyno chart.
Dyno charts are used by magazines, enthusiasts, and tuners to compare manufacturer power and torque claims against reality, as well as to measure gains after performance modifications.
We all refer to dyno charts to gain insight into engine performance, from headline-grabbing power and torque peaks to real-world power delivery across the entire rpm range.
While dyno curves play a key role in comparisons, they are limited if we use them only to compare the raw performance of two engines and then draw definitive conclusions about on-road behaviour.
To be clear, the dyno chart offers tremendous insight. After all, it shows engine power and torque throughout the rpm range. We use these dyno charts to compare engines because we can usefully overlay the charts of competing motorcycles and see the differences visually.
There is no doubt that a strong and reliable correlation exists between what the dyno chart shows and what translates to real performance on the road, whether riding in isolation or pitted against other machines.
You have no doubt compared dyno charts in magazine motorcycle group tests, drawn your own conclusions, and maybe even made buying decisions based on them.
Why Dyno Graphs do not tell the whole story
While the engine powers the motorcycle, and more power and torque often mean more performance in almost all cases, the engine does not exist in isolation.
If it did, the engine would be direct drive and deliver its power and torque to the wheels in a 1:1 ratio. In reality, there is a transmission, clutch and final drive that play a significant role in making the best use of the engine’s power and torque and delivering it to the wheels.
To explain simply, we will focus only on the transmission, because it allows the engine to express itself in more ways than one – most commonly through six gears.
If you ride a 5-speed, this still applies, so do not panic.
Your gear ratios are a multiplier of the torque your engine produces. Whatever torque the engine delivers, whether at its peak or anywhere in its rpm range, the gears multiply it.
Without multiple gears, your motorcycle’s performance on the road would be a compromise. If your motorcycle had just one gear and a top speed of 180 mph, acceleration at any speed below that would be far from optimal.
If strong acceleration was your priority, you would need a much lower gear and would have to accept a much lower top speed and poor fuel consumption
No conventional engine has enough torque to pull a high gear from low speed all the way up to 180 mph with the same thrust as a lower gear can provide.
Having multiple gears allows the engine to deliver more thrust across different speed ranges, from a standstill to top speed, making the best use of the engine’s performance.

We all know that first gear is always more accelerative than second gear, and so on. This is because a lower gear multiplies your engine’s torque more than the gear above it.
When you are stuck behind slow traffic and want to overtake, you will often drop down a gear or two. You are doing this because you want more multiplication of the engine’s torque, which we experience and feel as stronger acceleration.
You are also using the lower gear to keep the engine rpm at or near its peak torque output. A motorcycle with six gears gives the engine the opportunity to deliver its peak torque at six different points, each at a different road speed depending on the specifics of the motorcycle’s gearing.
This principle applies regardless of how much torque your engine produces. The more torque you have, the less often you may need to change down.
However, it still depends on other factors, such as how tall the gears are or how torquey the engine is in any given gear and speed.
Either way, the core principle remains the same: lower gears always deliver more thrust and acceleration.
So why does the above mean we should look at thrust curves more when making comparisons?
Well, put simply, an in-gear thrust curve shows your engine’s torque curve in each gear at any road speed, and is usually measured in pounds or Newtons.
If we compare two motorcycles with similar power and torque outputs, and we want to know which one would win a top-gear roll-on from a given speed, the thrust curve in sixth gear would often give us a definite answer, whereas the dyno chart would not in many cases.
Let me explain. Imagine we are comparing a Yamaha YZF-R1 and a Suzuki GSX-R1000. Perhaps the GSX-R1000 produces more torque than the R1 below 7000 rpm.
If we looked only at the dyno chart, we might assume the GSX-R1000 would beat the R1 in a 40 mph roll-on in top gear – a speed where both motorcycles are turning well below 7000 rpm.
But that is not always true, because each motorcycle may have slightly different gear ratios. To drive the point home, I will show the dyno curves and thrust curves of two very different motorcycles: a torquey 1000 cc L-twin and a peaky inline-four 600.
The litre bike twin, with its much greater torque, should easily pull away from the peaky 600 in a top-gear roll-on, right? Not always.
Before we go any further, let’s first understand gear ratios and how they multiply torque. It is actually quite simple.
Most motorcycles have six gears, along with a primary drive and a final drive ratio determined by the front and rear sprockets. To keep things simple, we will focus only on the individual ratios.
We will start with a 1:1 ratio. Imagine two gear cogs, both with the same number of teeth (1:1). A 1:1 ratio does not multiply the torque of the engine.
This is because if you spin the first cog through one full rotation, the second cog will also complete exactly one full rotation. That is why it is called a 1:1 ratio – both gears rotate fully when one is rotated fully.
Now consider a 2:1 gear ratio. One full rotation of the larger gear (gear 2) will cause the smaller gear (gear 1) to rotate twice.
With a 1:2 gear ratio, one full rotation of gear 1 will cause gear 2 to rotate only half a turn.
Which of these two ratios multiplies the torque (and halves the speed), and which one halves the torque (and doubles the speed)?
The 2:1 ratio halves the torque (thrust) but doubles the distance covered. The 1:2 ratio doubles the torque (thrust) but halves the distance covered. That is how you either multiply or divide the torque (and therefore the thrust) at the wheels.
Why would you ever choose a ratio that halves your torque?
Because you want to cover a greater distance in the same time – or, in motorcycle terms, achieve a higher top speed in that gear. And that is exactly why acceleration drops off while top-speed potential increases every time you change up a gear.
Let’s now compare two motorcycles with very different power and torque outputs and see how gearing choices affect real-world performance.
Here we have two motorcycles to demonstrate why gearing matters and how a thrust curve can reveal that fact.
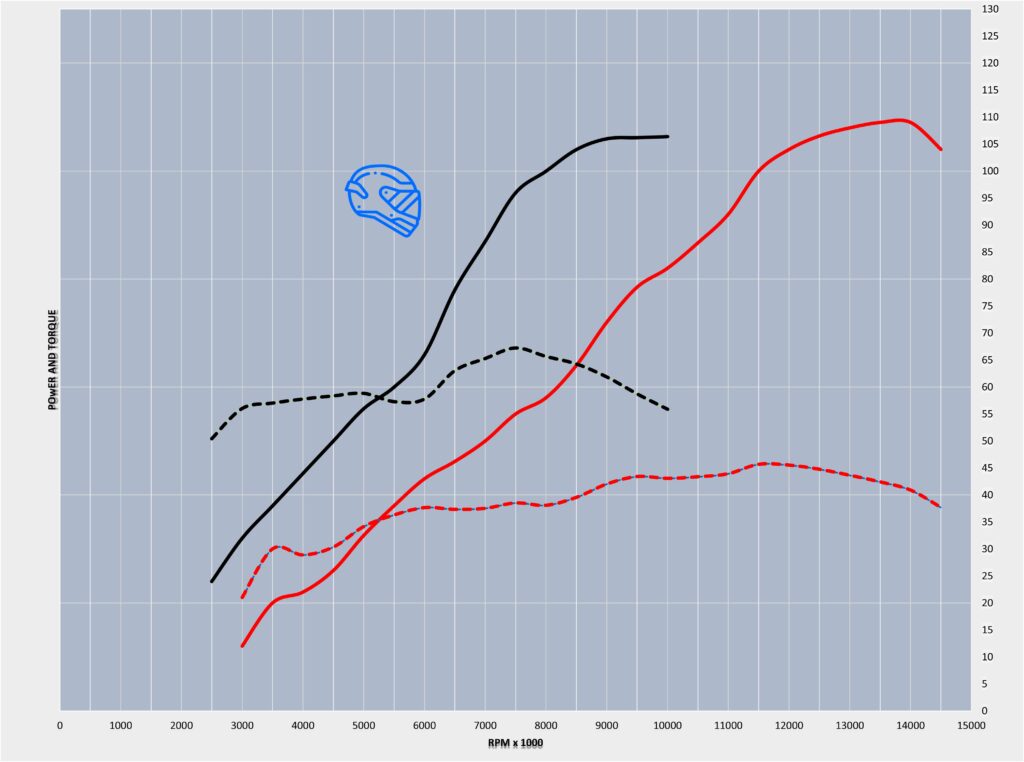
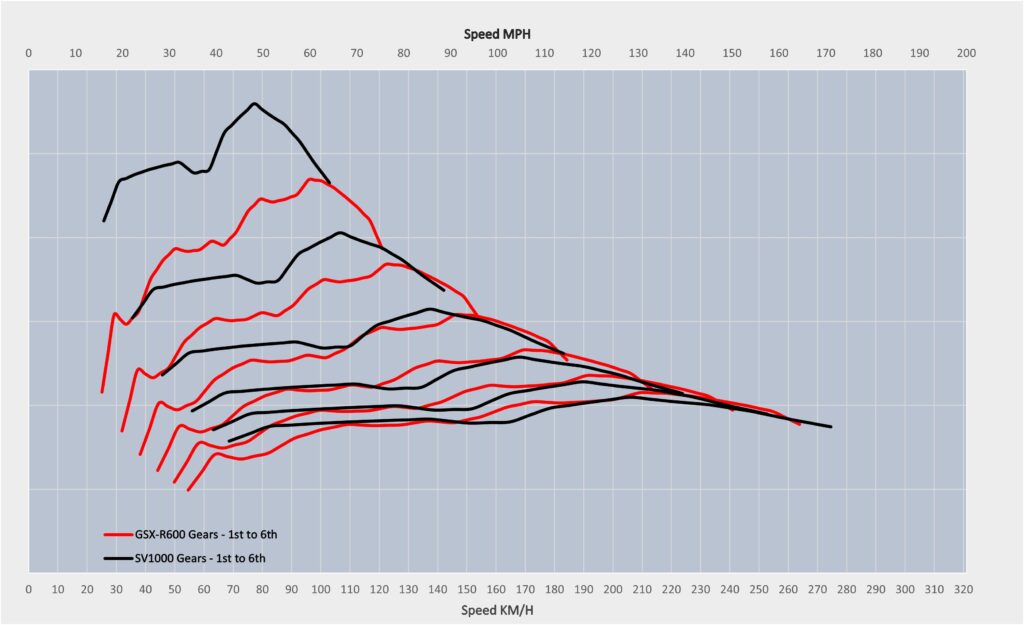
The black power and torque lines belong to a Suzuki SV1000, and the red lines to its sibling, the Suzuki GSX-R600.
One is a 1000 cc thumping L-Twin, the other a screaming 599 cc inline-four cylinder. They could not be more different. The SV1000 has a 66% larger displacement.
Peak power is broadly similar.
Thanks to the larger engine, the SV1000 produces 49% more torque at the wheels: 67 ft-lb compared with the GSX-R600’s 45 ft-lb.
Just those numbers alone, and a quick look at the dyno chart above, would suggest that the SV1000 completely dominates at every point.
The SV1000’s dominance on the dyno would indicate the same dominance on the road, in any gear, right? Not entirely. Once each motorcycle’s torque curve is multiplied by its gear ratios, a very different picture emerges.
Things are very different if we look at the thrust (acceleration) available in each gear at speed.
If you have not seen an in-gear thrust curve, let me explain what the graph is telling us.
Along the bottom axis, we have speed in km/h. Along the top axis, we have speed in mph. The – line belongs to the GSX-R600 while the – line belongs to the SV1000.
Each motorcycle has 6 lines, representing each of its 6 gears. The highest line for each motorcycle is first gear, followed by second, third, fourth, fifth, and finally sixth, which is the lowest line.
The higher the line, the more thrust and acceleration are available in the speed range of the gear. As you can see, lines for lower gears are always higher than those for lines for the corresponding gears. That’s because the lower the gear, the more thrust.
The longer the line, the higher the gear. That’s because higher gears have a wider speed range potential and a higher top speed than lower gears.
First gear for each motorcycle is the highest (thrust), but also the shortest in length. (Speed) Sixth gear for each motorcycle is the lowest (Thrust) and also the longest. (Speed)
You may have noticed that each thrust curve line mirrors the peaks and troughs and shape of the torque curve. You’d be right, that’s because each in-gear thrust curve is a multiplication of the motorcycle’s torque curve shown at speed.
Now to compare:
If you look at the chart, it is clear that in the first two gears the Suzuki SV1000 completely dominates the GSX-R600, just as it does on the dyno.
In third gear, the advantage remains strongly with the SV1000, but it is not nearly as dominant as in first gear. Why is that?
The gear ratios are different. In third gear, surprisingly, the GSX-R600 matches the SV1000 for thrust and acceleration between 110 and 120 km/h (68–74 mph). What that means in the real world is that if both motorcycles were in third gear, cruising at 100 km/h and then opened the throttle, their initial response and acceleration would be very similar for at least a short time.
Looking at the remaining gears, fourth, fifth and sixth, things become even more interesting because the two motorcycles are much more evenly matched. At the lower speed ranges of each of the last three gears, the SV1000 is still clearly dominant. However, in the middle speed ranges, the lines are very close together, and as speeds increase, the GSX-R600 starts to assert itself.
This is demonstrated clearly between 120–150 km/h in fourth gear, 135–170 km/h in fifth gear, and 150–180 km/h in sixth gear. How is that possible when the SV1000 produces 49% more peak torque and maintains a similar advantage across the entire rpm range? It is all down to gearing.
| Speed at 5000 rpm | SV1000 | GSX-R600 |
| Speed 1st Gear | 32mph +24% | 25.9mph |
| Speed 2nd Gear | 44.1mph +34% | 33mph |
| Speed 3rd Gear | 56.8mph +44% | 39.5mph |
| Speed 4th Gear | 69.5mph +52% | 45.7mph |
| Speed 5th Gear | 78.4mph +52% | 51.6mph |
| Speed 6th Gear | 85.3mph +51% | 56.5mph |
Above is a table showing speeds in each gear at an arbitrary 5000 rpm, comparing both motorcycles. We can clearly see that the SV1000 has much longer gearing, because at the same engine speed (RPM), it is travelling at substantially higher road speeds. The Suzuki SV1000’s gears are approximately longer by:
- First gear +24% longer
- Second gear + 34% longer
- Third gear + 44% longer
- Fourth gear + 52% longer
- Fifth gear + 52% longer
- Sixth gear + 51% longer
Now, go back and look at the thrust curve, and you can see those gear ratio percentage differences reflected in the graph. This explains why the GSX-R600 is so competitive.
In fourth and fifth gear, the Suzuki GSX-R600 comes closest to matching the SV1000, and in parts of the speed range (the second half) it actually exceeds the SV1000’s thrust output.
The SV1000 has 49% more peak torque, but in fourth, fifth and sixth gears it runs with 51% to 52%+ taller gear ratios.
That is why the GSX-R600 can match – and in some areas even exceed – the SV1000’s thrust and acceleration.
It is impressive that a motorcycle such as the GSX-R600 can, in certain gears and at certain speeds, match the thrust output of a much larger engine with significantly more torque.
You may be asking, “Why doesn’t the SV1000 simply use lower or identical gearing to the GSX-R600?” This is a good question, and the answer comes down to how high each engine can rev.
That advantage clearly belongs to the GSX-R600. This 600 cc screamer can rev beyond 15,000 rpm, while the Suzuki SV1000 has a rev limit of around 10,000 rpm.
Can you see the pattern? The GSX-R600 can rev around 50% higher than the SV1000, and the SV1000 is geared roughly 50% taller in some gears.
Because the GSX-R600 engine can spin so fast (15,000 rpm), it has the flexibility to run very short gear ratios that deliver strong thrust and acceleration without sacrificing top speed.
The SV1000, with 50% lower rev potential, cannot be geared the same way. If it used the same ratios as the GSX-R, it would lose up to 24–52% of its potential top speed in each gear.
Below shows the top speeds in each gear if the SV1000 had the same gear ratios as the GSX-R600, revving to its 10,000 rpm limit.
Because the SV1000 cannot spin the gears nearly as fast as the GSX-R600 (10,000 rpm versus 15,000 rpm), the top speed in each gear is severely limited. Thrust would be excellent, and it would be a wheelie machine, but it would run out of breath quickly and be terrible on fuel.
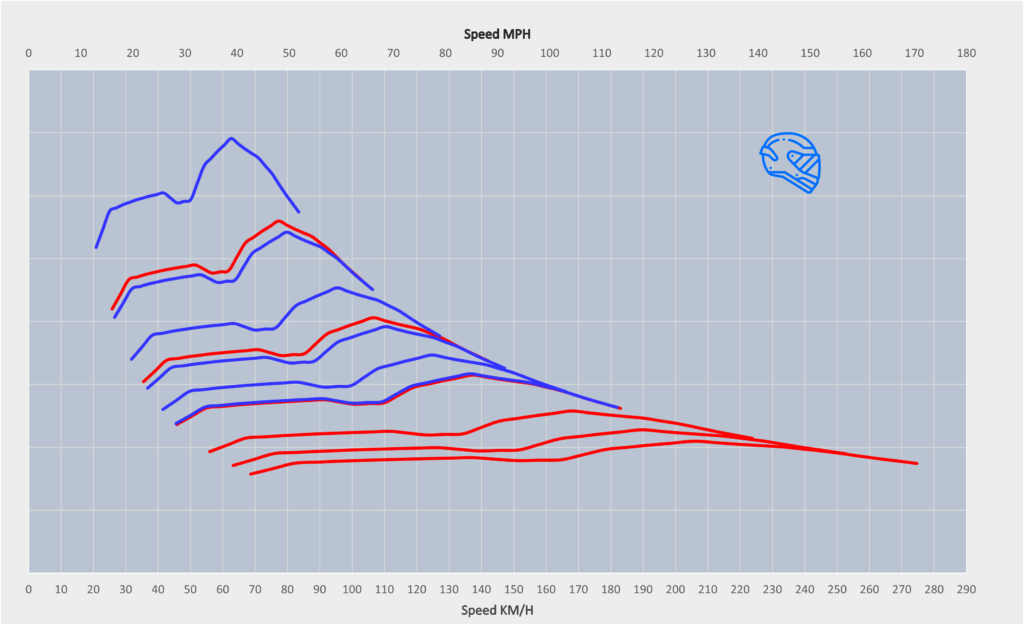
Above in Blue is an SV000 rubnning the same ratios as a GSX-R600. THrust is massively up, but top speed in each gear is limited. (113pmh in top gear_
| Speed at 10,000 rpm | SV1000 With GSX-R600 gearing |
| Speed 1st Gear | 51.7 mph |
| Speed 2nd Gear | 66 mph |
| Speed 3rd Gear | 78.9 mph |
| Speed 4th Gear | 91.4 mph |
| Speed 5th Gear | 103.2 mph |
| Speed 6th Gear | 113 mph |
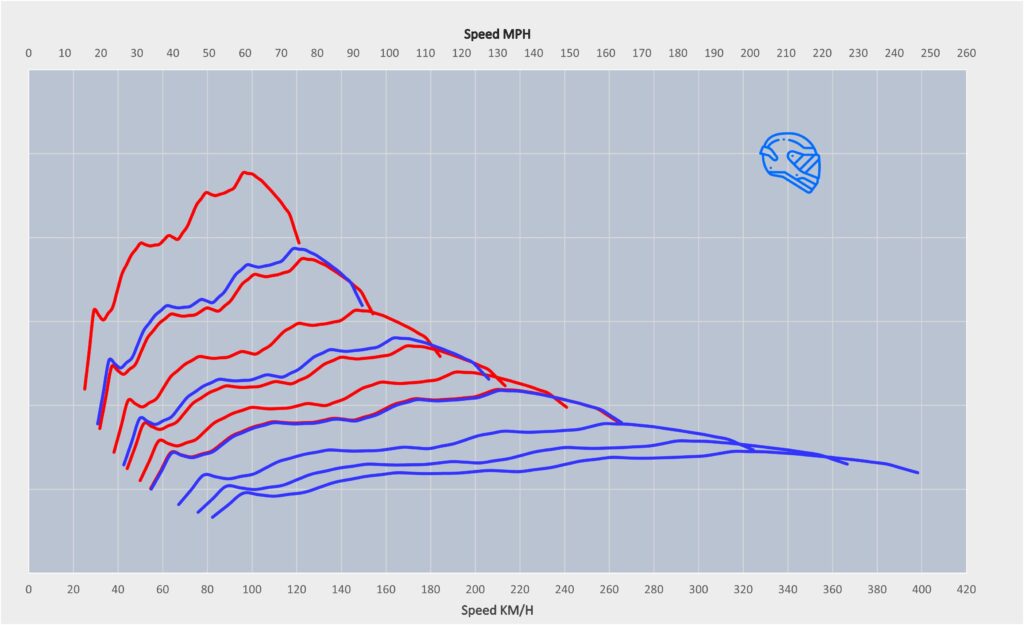
Below is the GSX-R600 running the same ratios as the SV1000 spinning at 15,000rpm. As you can see, the gearing is more than overkill.
The little GSX-R600 could not redline 3rd gear, making the remaining three gears pointless unless you want to save fuel.
Acceleration would be much more sluggish, too. Note the theoretical top speed in sixth is 255.8 mph.
GSX-R600 with the same Gearing as an SV1000 vs stock gearing –
| Speed at 15,000 rpm | GSX-R600 With SV1000 gearing |
| Speed 1st Gear | 95.9 mph |
| Speed 2nd Gear | 132.3 mph |
| Speed 3rd Gear | 170.5 mph |
| Speed 4th Gear | 208.4 mph |
| Speed 5th Gear | 235.3 mph |
| Speed 6th Gear | 255.8 5mph |
As you can see, gearing is important. When torque is multiplied or divided by the gearing and plotted on a chart, it can present a factual picture that the dyno curve cannot always show.
I have used an extreme case to demonstrate this point, but even when comparing motorcycles within the same class, gearing plays a significant role in either complementing or limiting an engine’s output when translated into real-world acceleration on the road.
Below is a comparison of a 1998 Yamaha R1 versus the latest model. The original R1 clearly has the torque advantage in the mid and lower rpm ranges, but this is not always translated into superior performance on the road in every gear at specific speeds.